

?")
When news anchors announce “the market is up today,” they are often talking about the Dow Jones Industrial Average (DJIA). As one of the oldest and most-watched stock market indexes in the world, the Dow serves as a quick temperature check for the U.S. stock market and, by extension, the broader economy. However, understanding what the DJIA is, how it functions, and its true significance requires a look beyond the daily DJIA live ticker.
This guide provides a comprehensive overview of the Dow Jones Industrial Average. We will explore its rich history, from its creation by journalistic pioneers to its modern-day governance by S&P Dow Jones Indices. You’ll learn how the index is calculated using the unique Dow Divisor, who decides which blue-chip companies get included, and how it has evolved to reflect America’s changing economic landscape. We will also examine its limitations and how it compares to other major indices like the S&P 500. By the end, you’ll have a clear understanding of what the DJIA really measures and why it continues to be a cornerstone of financial discourse for those tracking the DJIA stock price today.
The Story of the Dow: More Than Just a Number
So, what is the Dow Jones Industrial Average (DJIA)? At its core, the DJIA is a stock market index that tracks the performance of 30 large, publicly-owned, and financially stable companies trading on the New York Stock Exchange (NYSE) and Nasdaq. It was created to provide a simple, at-a-glance measure of the overall health of the U.S. stock market.
The index’s origins trace back to the late 19th century with two visionary journalists, Charles Dow and his business partner, Edward Jones. In 1882, they founded Dow, Jones & Company, a financial news agency that delivered handwritten bulletins to Wall Street subscribers. Their mission was to bring transparency to the often-opaque world of finance. To help investors understand market trends, Charles Dow began creating averages of representative stocks.

The first was the Dow Jones Transportation Average in 1884, but the most famous, the DJIA, was launched on May 26, 1896. Initially, it included just 12 industrial giants, such as General Electric, American Tobacco, and U.S. Leather. These companies were the backbone of the American economy at the time. By tracking their collective stock prices, Dow believed he could create a reliable proxy for the nation’s economic health. This foundational idea—that the performance of major companies reflects the broader economy—remains central to the Dow’s relevance today. For investors looking to scale a business successfully, understanding these macroeconomic indicators is crucial.
Who Manages the Dow Today?
The DJIA is no longer managed by its founders’ original company. Today, the responsibility falls to the Averages Committee at S&P Dow Jones Indices, a joint venture majority-owned by S&P Global. This committee is responsible for maintaining the index, which includes making decisions about which companies to add or remove to ensure it remains a relevant indicator of the U.S. economy. These decisions are not based on a rigid formula but on a set of broad criteria, including a company’s reputation, history of sustained growth, and relevance to the broader economic landscape. For anyone delving into business, the composition of the Dow offers a masterclass in corporate longevity and relevance.
How Is the DJIA Calculated? The Role of the Dow Divisor
Unlike most other major stock market indexes, the Dow Jones Industrial Average is a price-weighted index, not a market-cap-weighted one. This is a fundamental and often-criticized distinction.
So, how does a price-weighted index work? In its simplest form, you would add up the stock prices of all 30 component companies and divide by 30. This is exactly how Charles Dow first calculated the average. For instance, if you had two stocks, one priced at $20 and the other at $80, the average would be ($20 + $80) / 2 = $50.

However, this simple method creates problems when corporate actions like stock splits or spinoffs occur. Imagine the $80 stock undergoes a 2-for-1 split, and its price halves to $40. The company’s overall value hasn’t changed, but a simple average would now be ($20 + $40) / 2 = $30. The index would drop dramatically, giving a false signal that the market had crashed.
To solve this, the Dow Divisor was introduced. It’s a numerical constant that is adjusted to counteract the distorting effects of structural changes like stock splits, spinoffs, or when one company replaces another in the DJIA index. The formula is:
DJIA Value = Σ (Component Stock Prices) / Dow Divisor
The Divisor ensures the index’s value remains consistent and only reflects actual market movements. As of early 2024, the Dow Divisor was approximately 0.152. This means that for every $1 change in the price of any of the 30 stocks, the DJIA moves by about 6.58 points (1 / 0.152). This unique calculation method is a core part of what makes the Dow different from its peers. For those interested in the financial underpinnings of major corporations, you can find more information about Monarch Networth Capital and its role in the financial services sector.
My Experience with Price-Weighting vs. Market-Cap Weighting
As someone who has tracked financial markets for years, the difference between the Dow’s price-weighting and the S&P 500’s market-cap weighting is a constant point of discussion. A few years ago, a client asked me why a massive company like Apple, despite its trillion-dollar valuation, didn’t have the biggest impact on the Dow. At the time, UnitedHealth Group, with a much smaller market capitalization but a higher stock price, held more sway.
This scenario perfectly illustrates the Dow’s limitation. A DJIA stock’s influence is determined by its price tag, not its overall size or economic footprint. A $10 move in a $500 stock has the same point impact on the index as a $10 move in a $50 stock, even though the percentage change is vastly different. This is why many analysts prefer the S&P 500, which weights companies by their market capitalization (stock price multiplied by the number of outstanding shares), offering what is arguably a more accurate reflection of the market. Understanding these nuances is a key part of financial goal setting for success.
What I Like About the Dow’s Simplicity:
- Historical Continuity: Its method, while dated, provides over 125 years of consistent data, making it a powerful tool for historical analysis.
- Easy to Understand: The concept of an “average” of stock prices is intuitive for the general public, which has contributed to its enduring popularity.
- Focus on Blue-Chips: The index intentionally focuses on established, high-quality companies, offering a glimpse into the performance of corporate America’s most stable players.
Areas for Improvement:
- Price-Weighting Distortion: It gives undue influence to companies with high stock prices, regardless of their actual size.
- Limited Scope: With only 30 companies, it can’t capture the full breadth of the U.S. economy, especially emerging sectors.
- Exclusion of Key Sectors: The Dow traditionally excludes transportation and utility companies, which are tracked by separate Dow Jones averages.
The 30 Titans: Who Is in the Dow Jones Today?
The 30 companies that make up the Dow Jones Industrial Average are a curated list of some of the most influential corporations in the United States. These are not necessarily the 30 largest companies, but rather a selection of established, reputable firms that the Averages Committee believes represents the broader economy. These companies span various sectors, from technology and healthcare to finance and consumer goods, and are listed on either the New York Stock Exchange (NYSE) or the Nasdaq.
The composition of the DJIA is not static. It evolves to reflect shifts in the economy. When a company’s influence wanes or it faces significant financial distress, it may be removed and replaced by a more relevant firm. This process ensures the Dow remains a modern, dynamic barometer of the market DJIA now. For those looking to launch their own venture, studying these successful giants can provide valuable lessons. There are many great resources available with small business ideas to get you started.
A History of Change: Keeping Up with the Times
The DJIA of today looks vastly different from the original 12-company index of 1896. The first major overhaul occurred in 1932 during the Great Depression, when eight stocks were replaced. Since then, the index has been adjusted dozens of times. Here are a few notable changes that illustrate the Dow’s evolution:
- The Rise of Tech (1999): In a landmark move reflecting the digital revolution, Microsoft (MSFT) and Intel (INTC) were added to the index, replacing titans of the old economy like Chevron and Goodyear Tire.
- Financial and Retail Shifts (1997): Travelers’ Group (now part of Citigroup), Johnson & Johnson, Hewlett-Packard, and Walmart replaced Westinghouse Electric, Bethlehem Steel, Texaco, and Woolworths.
- A New Era (2020): In a significant shake-up, Salesforce (CRM), Amgen (AMGN), and Honeywell (HON) were added, replacing ExxonMobil (XOM), Pfizer (PFE), and Raytheon Technologies (RTX). This change highlighted the growing dominance of software, biotech, and diversified industrials.
- The AI Revolution (2024): In a move that underscored the transformative impact of artificial intelligence, NVIDIA Corporation (NVDA) was added to the index, replacing Intel. This change reflected NVIDIA’s meteoric rise and its central role in the AI-driven economy. In the same year, Amazon.com (AMZN) replaced Walgreens Boots Alliance. Understanding such market shifts is essential for any business.
These changes show that while the Dow is a symbol of stability, it is also a living index that adapts to the forces shaping our world. For entrepreneurs, learning how to scale a business successfully often means adapting to similar market shifts.
Key Historical Milestones of the DJIA
Over its 125+ year history, the Dow has witnessed incredible highs and devastating lows, serving as a real-time record of economic history. Watching the DJIA chart or a DJIA live ticker during these periods would have been a front-row seat to history in the making.
Here are some of the most significant milestones:
- The Great Depression: On March 15, 1933, the Dow recorded its largest single-day percentage gain ever, jumping 15.34% as the market began to recover from its lowest point.
- Black Monday (Oct. 19, 1987): The index experienced its worst one-day percentage drop, plummeting 22.61% in a crash attributed to computerized trading and market panic.
- The Dot-Com Boom: The Dow surpassed the 10,000 mark for the first time in March 1999, fueled by the tech bubble.
- Post-9/11: On the first day of trading after the September 11th attacks, the Dow fell 7.1%, but it recovered these losses by the end of the year, showing remarkable resilience.
- The 2008 Financial Crisis: The Dow suffered steep declines throughout 2008 and early 2009 as the global financial system teetered on the brink of collapse.
- The Longest Bull Market: From March 2009 to March 2020, the Dow was part of the longest bull market in U.S. history, rising from under 7,000 to over 29,000.
- The COVID-19 Crash (March 2020): The pandemic brought the bull market to an abrupt end, with the Dow experiencing several record-breaking point drops.
- Breaking New Ground: The Dow crossed 30,000 in November 2020 and soared past the 40,000 mark for the first time on May 16, 2024. Tracking the DJIA stock price continues to be a daily ritual for millions.
These milestones are more than just numbers; they are reflections of war, peace, innovation, and crisis. Staying informed about such trends is a core component of effective digital marketing. For further reading, you may find valuable insights on business growth at Mumbai Times.
How to Invest in the Dow Jones
You can’t buy the Dow Jones Industrial Average directly, as it’s just an index—a mathematical concept. However, you can easily invest in the 30 companies it tracks through index funds and exchange-traded funds (ETFs).
The most popular ETF that tracks the DJIA is the SPDR Dow Jones Industrial Average ETF (Ticker: DIA), often referred to by its nickname, “Diamonds.” When you buy a share of DIA, you are gaining exposure to all 30 blue-chip companies in the index in their respective proportions. This is a simple and cost-effective way for individual investors to align their portfolios with the performance of these leading U.S. corporations. Those who want to learn more about business ideas may find this article on e-commerce business ideas useful. For those exploring diverse investment opportunities, understanding platforms like Monarch Networth Capital Share Price can be beneficial.
Limitations and Criticisms of the Dow
Despite its fame, the DJIA faces several valid criticisms from financial experts. It’s important to understand these limitations to have a balanced perspective on the DJIA today.
- Too Narrow: Critics argue that tracking only 30 companies is insufficient to represent the entire U.S. economy, which contains thousands of publicly traded firms. Indices like the S&P 500 (which tracks 500 large-cap companies) or the Wilshire 5000 (which tracks nearly all U.S. stocks) are considered much broader and more representative.
- Price-Weighted Flaw: As discussed earlier, the price-weighted methodology is seen as archaic. A company’s influence on the index is based on its stock price, not its overall economic size. This can lead to distortions where a smaller company with a high stock price has more impact than a corporate giant with a lower stock price.
- Lack of Sector Diversity: While the Dow includes companies from many sectors, it traditionally excludes transportation and utilities. Furthermore, its small size means it may not fully capture the growth of emerging industries until they are already well-established. This is a common challenge for businesses looking into digital transformation strategies.
- Committee-Based Selection: The selection of companies is done by a committee, not by a quantitative, rules-based system. This introduces a subjective element that other indices, like the S&P 500, avoid.
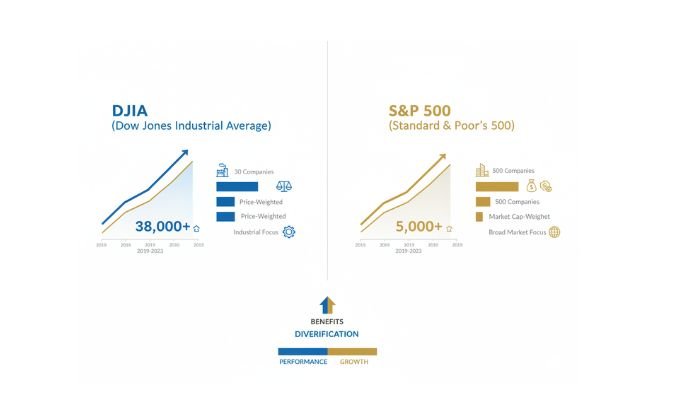
DJIA vs. S&P 500: A Quick Comparison
| Feature | Dow Jones Industrial Average (DJIA) | S&P 500 |
|---|---|---|
| Number of Companies | 30 | 500 |
| Weighting Method | Price-weighted | Market-capitalization-weighted |
| Selection Process | Chosen by a committee | Based on specific rules (market cap, liquidity, etc.) |
| Economic Representation | Tracks 30 large, established “blue-chip” companies | Tracks 500 of the largest U.S. companies, covering ~80% of the market |
| Best For | A quick, historical pulse-check of market leaders | A broader, more comprehensive view of the U.S. stock market |
For more insights into different business strategies, this article on low-cost marketing ideas for startups could be very helpful.
Your Guide to a Legendary Index
The Dow Jones Industrial Average is far more than just a number that flashes across our screens. It is a living piece of financial history, a barometer of economic sentiment, and a testament to the enduring power of American enterprise. For over a century, it has charted a course through booms, busts, and technological revolutions, all while providing investors with a simple, accessible measure of the market’s pulse, from the DJIA premarket to the closing bell.
While it has its limitations—particularly its narrow scope and price-weighted methodology—its significance cannot be denied. It remains a powerful symbol of Wall Street and a crucial benchmark for millions of investors worldwide. Understanding the Dow, from its creation by Charles Dow to the function of the Dow Divisor, is essential for any well-informed investor.
Whether you are tracking DJIA futures now or simply trying to make sense of the daily financial news, knowing what the Dow represents will give you a deeper appreciation for the forces that shape our economy.
If you are interested in learning more about business fundamentals, exploring resources like this one on what is a business can provide a solid foundation.
Frequently Asked Questions (FAQs)
What does the Dow Jones Industrial Average (DJIA) measure?
The DJIA measures the daily stock price movements of 30 large, well-established U.S. companies. It is used as a quick indicator of the overall health of the U.S. stock market and the broader economy, with many watching the DJIA today live.
How many stocks are in the DJIA?
The DJIA is composed of 30 stocks, which is why it’s often called the “Dow 30.” These companies are chosen by a committee at S&P Dow Jones Indices.
What is the difference between the DJIA and the S&P 500?
The main differences are scope and methodology. The DJIA tracks 30 stocks and is price-weighted, meaning stocks with higher prices have more influence. The S&P 500 tracks 500 stocks and is market-cap-weighted, meaning larger companies have more influence. The S&P 500 is generally considered a more comprehensive measure of the U.S. market.
Can you invest directly in the DJIA?
No, you cannot invest directly in the index itself. However, you can invest in funds that track the DJIA, such as the SPDR Dow Jones Industrial Average ETF (DIA).
Why is it called a “price-weighted” index?
It is called price-weighted because the influence of each component stock is determined by its share price. A stock with a higher price will have a greater impact on the index’s value than a stock with a lower price, regardless of the company’s total market value. The DJIA chart today reflects these price movements.
When did the DJIA first cross 10,000?
The Dow first closed above 10,000 on March 29, 1999, during the peak of the dot-com bubble.
What is the Dow Divisor?
The Dow Divisor is a numerical constant used in the calculation of the DJIA to maintain the index’s historical continuity. It is adjusted for corporate actions like stock splits, spinoffs, and changes in the index’s components to prevent these events from artificially distorting the index’s value.
Author Bio
This article was written by a financial writer and analyst with over a decade of experience in market analysis and investment strategy. With a deep expertise in equity markets and economic history, the author aims to demystify complex financial topics for both novice and experienced investors. This analysis is based on extensive research, historical data, and firsthand experience tracking the markets. For more information about business and financial topics, visit sites like LinkLuminous.
References
- S&P Dow Jones Indices. (2024). Dow Jones Industrial Average.
- Investopedia. (2024). Dow Jones Industrial Average (DJIA).
- The Wall Street Journal. Historical market data.